Marginal Rate of Substitution (MRS)
December 29, 2022
The amount of one good that a consumer can give up in exchange for more units of another good with equivalent utility is known as the marginal rate of substitution (MRS). MRS measures the relative marginal utility, making it one of the fundamental principles of the modern theory of consumer behaviour.
At equilibrium levels of consumption, marginal rates of substitution are calculated between commodity bundles at indifference curves and are comparable. An indifference curve can be used to plot combinations of two different goods that offer consumers equal utility and satisfaction. The MRS is based on the notion that differences between two substitute goods have no impact whatsoever on utility.
MRS is a tool used in economics to display the quantity of good Y and good X that may be substituted for one another. Another way to think of MRS is as two commodity bundles that provide a sense of compensation that is based on the uniform property feature.
The uniform property is an invariant property of uniform space when uniform isomorphism is taken into account in the mathematical discipline of topology. A preference relation between the uniform property and MRS is exemplified by a differentiated utility function.
Bounded rationality is a component of MRS, where consumers choose products to meet their needs rather than to find the best possible answer. From the indifference curve, it is connected to the analysis of customer behaviour.
The analysis of MRS revolves around the indifference curve. A consumer would substitute commodities X and Y at each point along the curve to feel exactly the same way before and after the transaction.
Neoclassical economics makes the assumption that goods and services are continuously divisible. This idea suggests that, despite the indifference curve’s direction being the same, MRS will be the same and correspond to its slope. MRS is a shifting curve because most indifference curves alter in slope as one travels along them.
When examining consumers’ spending patterns using the indifference curve, declining MRS is assumed in the case of substitute products. When a consumer substitutes commodity X for commodity Y, the stock of X falls, the stock of Y declines, and the MRS lowers, according to the premise of diminishing MRS.
In other words, when the consumer owns more of commodity X, he is willing to forsake commodity Y. An indifference curve that shows how the MRS of the two goods decreases over time might be used to illustrate the idea. Nevertheless, this law does not apply to perfect and complementary products.
MRS is essentially the indifference curve’s slope at any given location on the curve. Because you will consume less of the other good as you consume more of the former, the majority of indifference curves are convex. So, as one descends the indifference curve, MRS will decline. The law of diminishing marginal rate of substitution is what is responsible for this. The indifference curve will be concave if the marginal rate of substitution is rising; nevertheless, this is uncommon. In this case, a consumer would consume more of X in exchange for higher consumption of Y.
For the marginal rate of substitution analysis, it is crucial to know the slope of the indifference curve. MRS is essentially the indifference curve’s slope at any given location on the curve. The slopes will change as one travels along the majority of indifference curves since they are curves. Because you will consume less of the other good as you consume more of the former, the majority of indifference curves are convex. If the slope is constant, an indifference curve can be represented by a straight line with a downward slope. The indifference curve will be concave to the origin if the marginal rate of substitution is rising. This is uncommon in most cases because it implies that consumers would consume more of X in order to enhance their consumption of Y. (and vice versa). Typically, marginal substitution is declining, which means that instead of continuously consuming more of the substitute, the consumer decides to swap it for the original commodity.
Example: Take a store that sells tea and soft drinks as an illustration. In order to find out what combination of tea and soft drinks will make a consumer pleased, a researcher may speak with them. In keeping with the scenario, you then plot the marginal utility values on a chart, designating one product—tea, for instance—as Good X on the x-axis and another—soft drinks—as Good Y on the y-axis.
In this case, the user will drink less tea as they purchase more soft drinks (a higher number of units) (a lower number of units). In order to create the slope known as the indifference curve, you would need to measure many consumers and connect the points on the x- and y-axes.
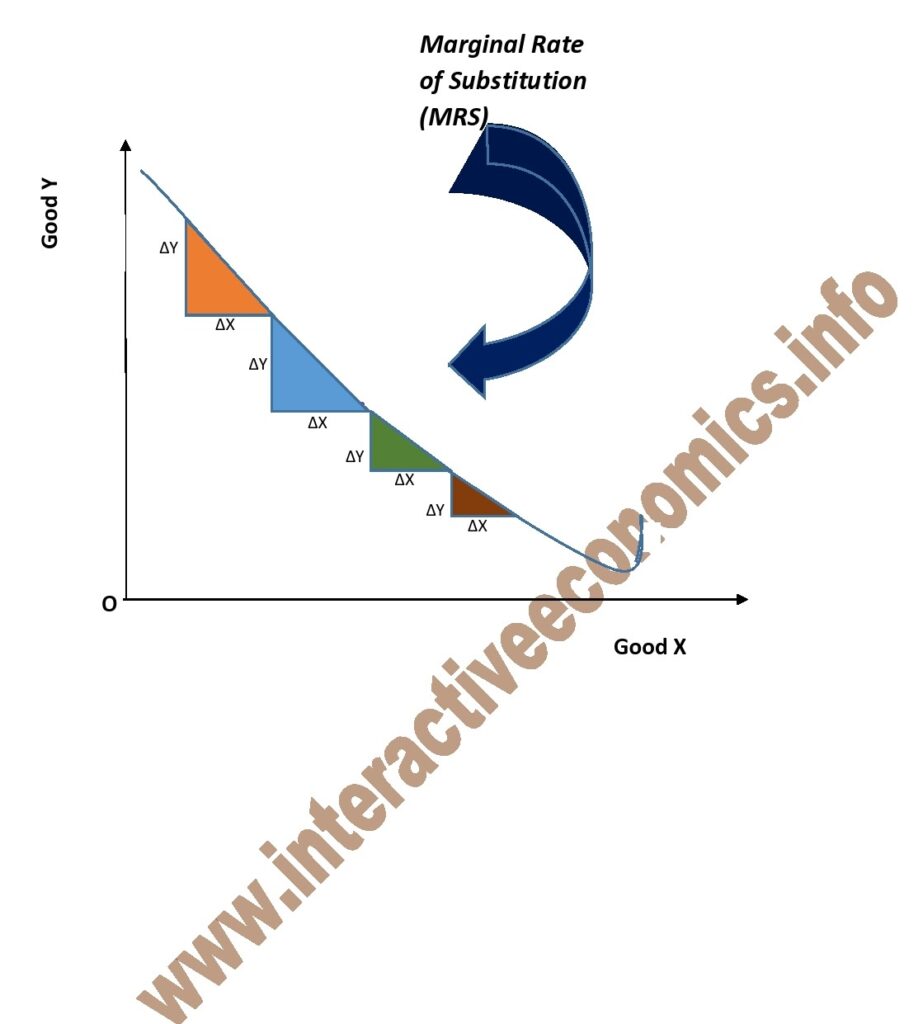
One can calculate the marginal rate of substitution as
M.R.S. Y X = Δ X / Δ Y, on any point on the indifference curve.
For any consumer, utility function (U) is a function of the quantities of goods. Suppose there are two commodities x1 and x2. Then
U = f (x1, x2) = constant = U0.
Taking total differential, we get
d U = ∂ f / ∂ x1 . d x1 + ∂ f / ∂ x2 . d x2 = d U0 = 0
⇒ f x1 d x1 + f x2 d x2
⇒ − d x2 / d x1 = f x1 / f x2 = (∂ U / ∂ x1 ) ÷ (∂ U / ∂ x2) = MU x1 / MU x2
The slope (d x2 / d x1) of the tangent at any point on an indifference curve is the rate at which x1 must be substituted for x2 or vice versa.
The negative of the slope (− d x2 / d x1) is the marginal rate of substitution of x1 for x2.
Indifference curves are frequently used in three different kinds of graphs to examine consumer behaviour:
- For a certain entrepreneur, the utility of consumption is defined using the first graph. As the quantity of good X is reduced, MRS travels to zero, and as the quantity of good Y is reduced, it moves to infinity.
- The second type of graph includes X and Y perfect substitutes. Due to the lines’ parallelism and the slopes’ 45° angle with each axis, the MRS along the difference curve is equal to 1. MRS is characterised as a fraction since the slope varies when different goods substitutes are taken into account. MRS will remain constant for ideal replacements.
- The horizontal portion of each indifference curve for the third type of graph, which represents complementary items, displays an MRS of 0.
Assumptions of Marginal Rate of Substitution
1) The size and shape of the goods are uniform.
2) There is no lag in consumption.
3) Income, preferences, tastes, or fashion remain unchanged.
4) Usefulness is crucial.
5) The constant marginal unit of currency.
6) Each unit of commodities is consumed by the consumer because they are rational and knowledgeable.
Limitations/Exceptions of the Marginal Rate of Substitution
One of the problems with the marginal rate of substitution is that it does not take into account combinations of products that a consumer would gladly exchange for different combinations when evaluating a product. Due to this, MRS analysis is limited to just two variables. Additionally, MRS does not actually analyse marginal utility because it treats the usefulness of two substitute product equally, even though this may not always be the case.
There are several limitations on the marginal rate of substitution. The fundamental flaw is that it doesn’t analyse whether a consumer would choose one combination of items over another. This often restricts the MRS analysis to two variables. Additionally, because MRS evaluates the utility of both comparable commodities identically even though they may have different usefulness in reality, MRS does not always consider marginal utility.
This law doesn’t apply to
- Dissimilar units.
- Unreasonable quantity.
- Unsuitable time period.
- Rare collections like coins, stamps etc.
- Change in taste and fashion of the consumer.
- Abnormal person.
- Changing the income of the consumer.
- Habitual goods.
- Durable and valuable goods.
Types of Marginal Rate of Substitution
1) Diminishing
The marginal rate of substitution is decreasing. If the buyer is ready to give up progressively fewer units of good Y for each incremental unit of good X, one can acquire it.
2) Constant
Additionally constant is the marginal rate of substitution. If only one unit of X is sacrificed in exchange for one extra unit of Y, one can achieve this. The ideal substitute is constant.
3) Increasing
Consider a scenario where a consumer gradually switches from one commodity, X, to another, Y, in order to retain the same degree of satisfaction. A growing marginal rate of substitution is possible in this situation.
KEY POINTS
1) The willingness of a consumer to switch from one good to another good, provided the new good is as satisfactory, is known as the marginal rate of substitution (MRS).
2) The slope of the indifference curve, which depicts a frontier of utility for each combination of “good X” and “good Y,” is known as the marginal rate of substitution.
3) The MRS takes the shape of a downward, negative-sloping, convex curve when the law of diminishing MRS is in operation, indicating higher consumption of one good in place of another.
4) In accordance with the law of diminishing marginal rates of substitution, MRS declines as one descends the indifference curve, a typical convex-shaped curve.
5) The equilibrium between two desirable resources or products that is attained without sacrificing utility is shown by the marginal rate of substitution.
6) The indifference curve theory, which examines how consumers respond to various products in order to achieve the same level of satisfaction, incorporates MRS.
7) The MRS is calculated using the following formula: Change in good y/Change in good x
8) Additionally, an indifference curve involving the two products is drawn for the MRS’s graphic depiction.
9) The idea has limits because it can only be applied to two commodities.